Sportsbook market report: October 2026
How US sportsbooks priced NBA and NFL markets, and how their player prop lines did against the box score. This edition is fixed: the numbers are the season to date at the end of October 2026 and will not change.
Key numbers
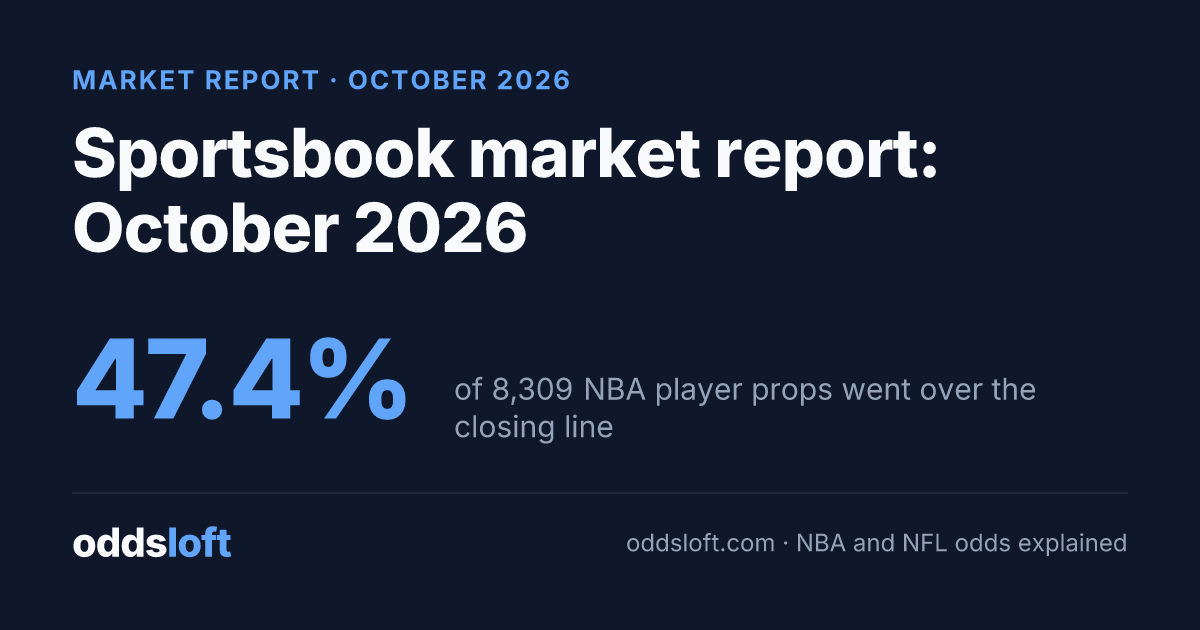
- NBA: 8,309 player props graded since 2026-10-20; 47.4% went over and 52.6% went under the consensus closing line.
- NBA: the most lopsided stat was assists, where the under won 54.9% of 1,007 lines.
- NBA: average player prop margin ran from 6.18% at FanDuel to 7.68% at Betway.
- NFL: 3,572 player props graded since 2026-09-27; 48.9% went over and 51.1% went under the consensus closing line.
- NFL: the most lopsided stat was rushing yards, where the under won 56.4% of 454 lines.
- NFL: average player prop margin ran from 5.84% at DraftKings to 7.88% at Fanatics.
NBA: margin by sportsbook
The overround: both sides' implied chances at the book's closing prices, added up, minus 100%, averaged over its lines. A -110/-110 market is 4.76%. Lower is cheaper for the bettor. Props are weighted by the number of lines in each stat.
| Sportsbook | Moneyline | Spread | Total | Player props | Prop lines |
|---|---|---|---|---|---|
| FanDuel | 4.09% | 4.87% | 4.81% | 6.18% | 7,856 |
| DraftKings | 5.06% | 5.51% | 5.54% | 6.54% | 4,238 |
| Fanatics | 4.49% | 4.77% | 4.79% | 7.00% | 825 |
| BetMGM | 4.56% | 4.65% | 5.03% | 7.11% | 4,972 |
| Caesars | 4.38% | 4.76% | 4.77% | 7.22% | 3,524 |
| betPARX | 4.82% | 5.12% | 5.11% | 7.30% | 7,645 |
| BetRivers | 5.38% | 5.55% | 5.56% | 7.67% | 4,827 |
| Betway | 6.45% | 6.73% | 6.65% | 7.68% | 1,396 |
NBA: player props, over or under?
"Priced over" is the market's own chance of the over at the consensus closing line: each book's two prices with the margin removed, the median across books, averaged per stat. When overs land less often than priced, the closing line was set a little high for that stat. Small gaps are within normal variation for samples this size.
| Stat | Lines | Over | Under | Priced over |
|---|---|---|---|---|
| Points | 1,239 | 48.5% | 51.5% | 50.2% |
| Rebounds | 1,176 | 49.7% | 50.3% | 48.8% |
| Pts + Reb | 1,142 | 49.2% | 50.8% | 49.8% |
| 3-pointers | 1,040 | 45.7% | 54.3% | 47.4% |
| Assists | 1,007 | 45.1% | 54.9% | 48.9% |
| Pts + Reb + Ast | 930 | 45.3% | 54.7% | 49.2% |
| Pts + Ast | 899 | 46.7% | 53.3% | 49.8% |
| Reb + Ast | 876 | 48.4% | 51.6% | 49.8% |
NFL: margin by sportsbook
The overround: both sides' implied chances at the book's closing prices, added up, minus 100%, averaged over its lines. A -110/-110 market is 4.76%. Lower is cheaper for the bettor. Props are weighted by the number of lines in each stat.
| Sportsbook | Moneyline | Spread | Total | Player props | Prop lines |
|---|---|---|---|---|---|
| DraftKings | 4.28% | 4.67% | 4.71% | 5.84% | 3,693 |
| FanDuel | 4.04% | 4.80% | 4.80% | 6.43% | 2,723 |
| BetMGM | 4.27% | 3.73% | 4.48% | 7.06% | 3,162 |
| BetRivers | 4.81% | 5.01% | 4.98% | 7.24% | 1,911 |
| Fanatics | 4.56% | 4.72% | 4.75% | 7.88% | 972 |
NFL: player props, over or under?
"Priced over" is the market's own chance of the over at the consensus closing line: each book's two prices with the margin removed, the median across books, averaged per stat. When overs land less often than priced, the closing line was set a little high for that stat. Small gaps are within normal variation for samples this size.
| Stat | Lines | Over | Under | Priced over |
|---|---|---|---|---|
| Receiving yards | 927 | 49.7% | 50.3% | 50.0% |
| Receptions | 923 | 49.0% | 51.0% | 48.9% |
| Rushing yards | 454 | 43.6% | 56.4% | 49.9% |
| Rush attempts | 272 | 48.2% | 51.8% | 49.7% |
| Rush + Rec yards | 230 | 46.1% | 53.9% | 50.1% |
Cite this report
You are welcome to quote any number on this page with a link back. The edition never changes, so the link stays accurate.
Oddsloft, "Sportsbook market report: October 2026", October 31, 2026, https://oddsloft.com/research/market/2026-10
Oddsloft. (2026, October 31). Sportsbook market report: October 2026. https://oddsloft.com/research/market/2026-10
<a href="https://oddsloft.com/research/market/2026-10"><img src="https://oddsloft.com/og/research/market/2026-10.png" alt="Sportsbook market report: October 2026: NBA player props went over 47.4% of the time (8,309 lines); NFL player props went over 48.9% of the time (3,572 lines)" width="600" height="315" loading="lazy"></a>
<p>Source: <a href="https://oddsloft.com/research/market/2026-10">Oddsloft</a></p>
Method
Prices are archived from US-licensed sportsbooks up to the start of each game; exchanges and prediction markets are left out. For every player and stat, the consensus closing line is the line most books closed on (on a tie, the one nearest their median, so always a real line). Each prop is graded against the official box score; a player who did not play leaves his line void. Only finished games count. A stat needs 200 graded lines and a book 30 lines to be shown. Full details: methodology. Related: which sportsbook charges the most vig, do prop overs or unders hit more, hold vs vig.
Other editions: September 2026.